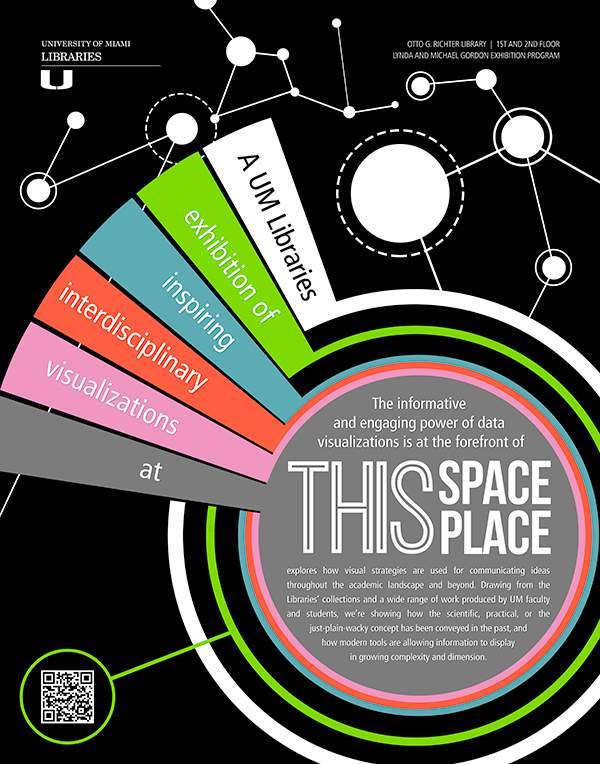
This Space, This Place explores how visual strategies are used for communicating ideas throughout the academic landscape and beyond. Drawing from the Libraries' collections and a wide range of work produced by UM faculty and students, we're showing how the scientific, practical, or the just-plain wacky concept has been conveyed in the past, and how modern tools are allowing information to display in growing complexity and dimension.
Choose the corresponding tabs above to find out more information. Each tab represents a display case or wall display.
Shifting Boundaries: The maps in this case offer a series of inaccurate depictions of Florida and the islands and territories surrounding the state, as well as some with more precise contours.
Shifting Perceptions: Maps in this case showcase the push towards development spurred on by the expansion of the railroad system, and in particular Henry Flagler’s investment in the rapid development of what was previously sparsely inhabited marshy territories.
Digital Humanities: Included in this case are four select Digital Humanities projects from faculty at the University of Miami.
UM Research Visualized: Researchers across the sciences at UM use visualizations to clarify and communicate their data. Here we have examples from artificial intelligence research, drug development and weather modeling.
Coral Reef Diseases: An educational showcase for the different types of mapping options available for the Biscayne National Park and its benthic habitats.
Fun, Quirky, Unique: From lost pirate treasure and roller-skating fairies, haunted warehouses, strange sea monsters and a famous mouse, Florida is full of special places unlike anywhere else!
GIS and Data Visualization: A selection of print and electronic books on GIS and Data Visualization available at the Richter Library.
Shark Bay Project: Visualization of the preliminary results of the stable isotopic data, recorded from the sediments collected at Hamelin Pool in March 2013.
Map Collection: In addition to the usual topographic and road maps, there are many special types such as geologic, historical, and thematic. A selection of these maps are on display.
Student Gallery: Geographic Information Systems (GIS) are now widely used as a means of visualizing data and are often included as part of a student’s training in many different fields. These posters are examples of work done by current University of Miami students.
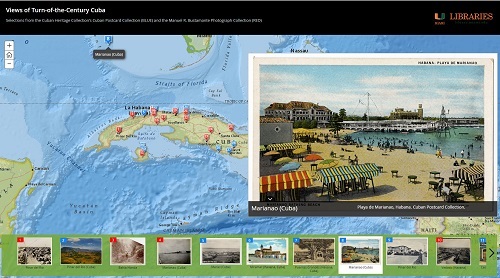
Interactive Maps: Selections from the Cuban Heritage Collection’s Cuban Postcard Collection and the Manuel R. Bustamante Photograph Collection, as well as a showcase of intimate locations, marine animals, and beautiful scenery from Biscayne National Park.
Choose the corresponding tabs above to find out more information. Each tab represents a display case or wall display.
Shifting Boundaries: The maps in this case offer a series of inaccurate depictions of Florida and the islands and territories surrounding the state, as well as some with more precise contours.
Shifting Perceptions: Maps in this case showcase the push towards development spurred on by the expansion of the railroad system, and in particular Henry Flagler’s investment in the rapid development of what was previously sparsely inhabited marshy territories.
Digital Humanities: Included in this case are four select Digital Humanities projects from faculty at the University of Miami.
UM Research Visualized: Researchers across the sciences at UM use visualizations to clarify and communicate their data. Here we have examples from artificial intelligence research, drug development and weather modeling.
Coral Reef Diseases: An educational showcase for the different types of mapping options available for the Biscayne National Park and its benthic habitats.
Fun, Quirky, Unique: From lost pirate treasure and roller-skating fairies, haunted warehouses, strange sea monsters and a famous mouse, Florida is full of special places unlike anywhere else!
GIS and Data Visualization: A selection of print and electronic books on GIS and Data Visualization available at the Richter Library.
Shark Bay Project: Visualization of the preliminary results of the stable isotopic data, recorded from the sediments collected at Hamelin Pool in March 2013.
Map Collection: In addition to the usual topographic and road maps, there are many special types such as geologic, historical, and thematic. A selection of these maps are on display.
Student Gallery: Geographic Information Systems (GIS) are now widely used as a means of visualizing data and are often included as part of a student’s training in many different fields. These posters are examples of work done by current University of Miami students.
Interactive Maps: Selections from the Cuban Heritage Collection’s Cuban Postcard Collection and the Manuel R. Bustamante Photograph Collection, as well as a showcase of intimate locations, marine animals, and beautiful scenery from Biscayne National Park.
Case Summary
Although early maps of Florida abound, they are often incorrect. Many of the earliest maps were simply the graphic results of hearsay, of travelers’ accounts and narratives interpreted by mapmakers who had never actually seen the continent of North America. The maps in this case offer a series of inaccurate depictions of Florida and the islands and territories surrounding the state, as well as some with more precise contours.
Although most of the maps in this case are reproductions, visitors to Special Collections (8th floor of Richter Library) can view hand-colored engravings and even some hand-drawn maps from this period. We are open to the public Monday through Friday, 9-4 pm.
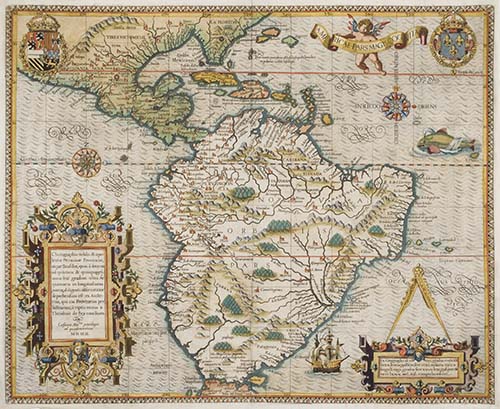
Americae pars magis cognita. chorographia nobilis & opulentae Peruanae Provinciae, atique Brasiliae
Theodore de Bry
Frankfurt, 1592
Scan of the original copperplate engraving held in Special Collections
This colorful map illustrated Spanish possessions in the Americas, and comes from the third part of de Bry’s Grand Voyages, an account of the travels of the explorers Johann van Stadden and Jean de Lery during the 1540s and 1550s. The image of the Florida peninsula is based on de Bry’s own design, while the map of South America on a 1587 map by Peter Martyr. The coast of Chile features an exaggerated bulge that was discontinued in Abraham Ortelius’s cartography in 1587.
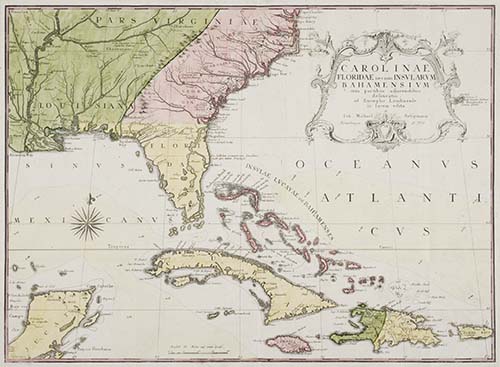
Carolinae Floridae nec non Insularum Bahamensium cum partibus adjacentibus delinatio ad Exemplar Londinense in lucem edita...
Mark Catesby and Johan Michael Seligman
Nuremberg, 1755
Scan of the original copperplate engraving held in Special Collections
Catesby and Seligman’s celebrated map is colored to show the British Colonies in red, French possessions in green, and the regions controlled by Spain in yellow, and is one of the earliest large scale maps of the region. Catesby was particularly meticulous in depicting the coasts and rivers in the Southeast, as well as Indian, English, French, and Spanish settlements in the regions.
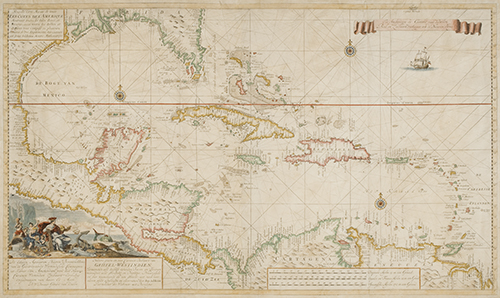
Nouvelle carte marine de toute les cotes de l’Amerique...
Gerard van Keulen
Amsterdam, early 1700s
Scan of the original hand-colored engraving held in Special Collections
Gerard Van Keulen’s rare map of the Caribbean, Central America, and Florida resembles a portolan chart, an early European navigation chart with rhumb lines (or lines crossing all meridians of longitude at the same angle) that radiate from compass points or the direction of the winds. The actual engraved map, which is too large to feature in this case, provides an up-close look at the hand-colored illustrations of compass roses, a cartouche showing sea creatures, and reveling “natives,” a sailing ship, and very detailed information of the coasts; Florida, alone, has more than fifty place names.
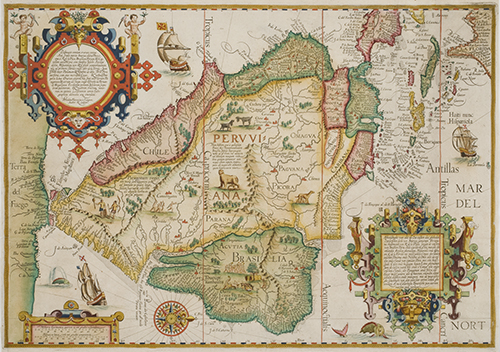
Delineatio omnium orarum totius Australis
Jan Huygen Van Linschoten
Amsterdam, 1596
Scan of the original copperplate engraving held in Special Collections
A remarkable map of South America, the Caribbean islands, and Florida, shown on a horizontal axis, where north is to the right of the map. Typically for maps of that era, the outline of Florida is fanciful at best, but there are place names and an attempt to depict the Keys. The coastlines feature locality and place names, while the interior is filled with imaginary mountains, rivers and cartoon-like monsters, cannibals, and numerous charming animals. The compass rose and cartouches (the images on the upper left and lower right of the map) are a particularly beautiful example of sixteenth-century mapmaking.
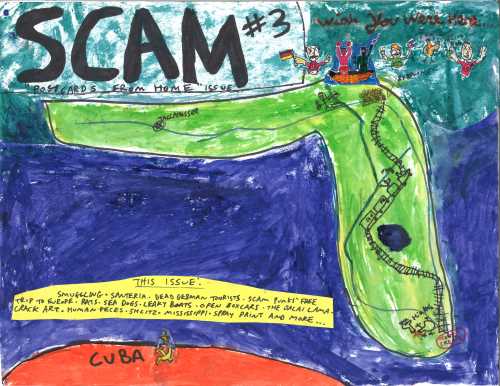
Original artwork for “Scam Issue #3: Postcards from Home”
Scam, Iggy (Erick Lyle)
Gainesville, FL, no date
Erick Lyle is a writer, musician and activist, originally from the South Florida area. For over 20 years, he has been the writer and editor of the zine “Scam.” His work explores a rich subculture of "underground America", where political activism and the punk rock music scene meet. His writing and music brings attention to issues such as homeless rights, anti-war and anti-capitalist sentiments, and an anarcho-punk lifestyle of train hopping and squatting. Though no longer based in Miami, Lyle's writing and experience leaves a rich legacy of a lifestyle and culture not commonly documented in the region. Lyle’s mixture of affection and critical analysis of Florida tropes and platitudes is evident in his own unique maps of the State.
Above: Cover for a never-published issue of Scam.
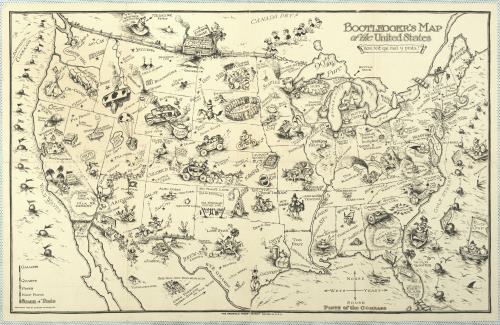
Bootlegger’s Map of the United States
Detroit: Griswold Press, 1926
A pun-filled depiction of the United States in the Prohibition era. The designer, Edward Gerstell McCandlish (born 1887), had a variety of careers, including staff cartoonist at the Washington Post. Note that his depiction of Florida as a real-estate scam zone hasn’t changed much in almost a century.
Promotional Postcards
1920s-1940s
Florida Postcard Collection (Special Collections)
Cram’s Standard American Railway System Atlas
Cram, George Franklin
New York: George Cram, 1894
This atlas would have been a fixture in railway stations around the country, and is a clear visual testament of the influence the spread of railroads had on the development of communities. The colored lines indicate the variety of private railroads crisscrossing the northern part of the state, while South Florida remains almost entirely undeveloped. Try to find Miami on the map…
Case Summary
The Digital Humanities is a burgeoning field concerned with the intersections of computing and the humanities. Advances in digital capabilities have created exciting platforms for scholars to present their work visually, while transforming static or remote information into an approachable and/or interactive experience. This new field of content visualization has also provided opportunities for creative interdisciplinary collaboration amongst scholars. Included in this case are four select Digital Humanities projects from faculty at the University of Miami. Each unique project includes an image of the project, and a summary in the words of the creator (s).
The Digital Humanities is a burgeoning field concerned with the intersections of computing and the humanities. Advances in digital capabilities have created exciting platforms for scholars to present their work visually, while transforming static or remote information into an approachable and/or interactive experience. This new field of content visualization has also provided opportunities for creative interdisciplinary collaboration amongst scholars. Included in this case are four select Digital Humanities projects from faculty at the University of Miami. Each unique project includes an image of the project, and a summary in the words of the creator (s).
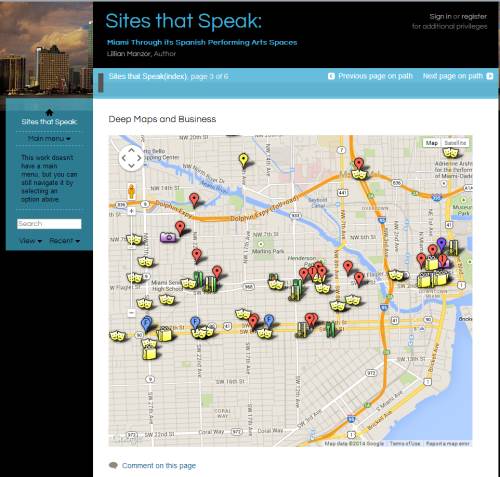
Sites that Speak: Miami Through its Performing Arts Spaces in Spanish
[http://scalar.usc.edu/hc/sites-that-speak/index.vispath]
Dr. Lillian Manzor
Department of Modern Languages and Literatures, University of Miami
Sites that Speak is a multimodal publication using Scalar that focuses on the development of Spanish theater in Miami through the research of its performing spaces from 1959 to 1980. It maps-- literally and figuratively-- the development of Spanish theater from garages to Teatro Martí --a Ku Klux Klan meeting space in the 40s and to the Gables Cinematheque, previous home of Teatro Avante. By doing a deep cultural mapping of Spanish theater in Miami, I demonstrate the ways in which claiming a space as a theatrical space, in addition to adding to the cultural development of our city, has contributed to the survival of theater as an art form, as intangible cultural heritage of a community in the making. In so doing, I also analyze the economic and socio-political transformation of the different communities that have contributed to the transformation of Miami into a global city. (The prototype was developed at the 2012 NEH Summer Institute for Advanced Topics in the Digital Humanities.)
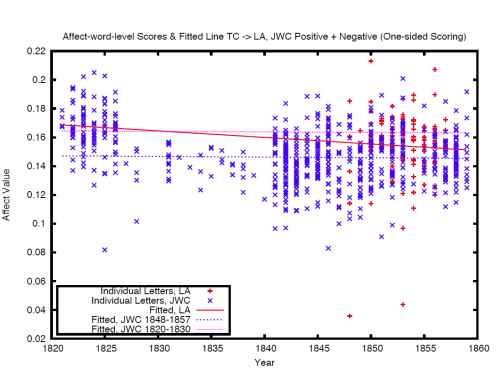
Affect Expressed in Letters
Hu Yajie (Google), Neil Johnson (UM), Brent Kinser (Western Carolina University), Mitsunori Ogihara (UM), Dingding Wang (UM),
Guannan Zhao (UM)
The Duke-Edinburgh Edition of The Collected Letters of Thomas and Jane Welsh Carlyle (Duke University Press) is a 41-volume collection of letters written by the Victorian historian and essayist Thomas Carlyle (1795-1881) and his wife Jane Baillie Welsh Carlyle (1801-1866). In this map we examine the emotions represented in the letters exchanged in the letters from TC to JBW (pre-marriage), the letters from TC to JBW (post-marriage), and the letters from TC to Harriet, Lady Ashburton (HLA). In the early 1850s, TC and HLA developed a close relationship that would serve later historians as the locus for describing the quality of the Carlyle marriage, which became a paradigmatic example of oppressive Victorian sexual politics.
By way of computational parsing with a data set of emotional strengths of affect words, we calculate the emotional level of each letter as well as the mean plot of each group of letters.
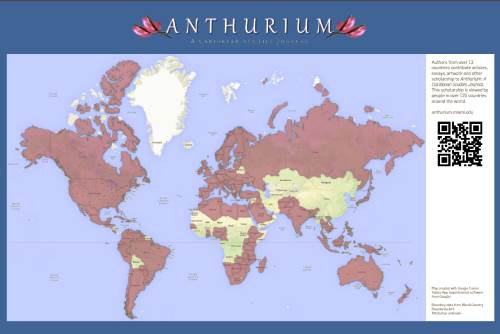
Anthurium: A Caribbean Studies Journal
[http://anthurium.miami.edu/]
Dr. Patricia Saunders, English Literature
University of Miami
Established in 2003, Anthurium: A Caribbean Studies Journal, immediately joined the vanguard of the digital humanities movement. Since then, Anthurium has made consistent strides in shaping a broad range of critical thought in Caribbean studies. As an open-access, web-based journal, Anthurium's readership far exceeds that of traditional print journals. By maintaining the highest standard in scholarship, the journal continues to attract scholarly contributions from critics and creative writers worldwide. Additionally, collaboration between the English Department, the UM Libraries, and the College of Arts and Sciences has generated a vast repository of digital archives from the Caribbean Writers Summer Institute (1991 - 1996). This archive contains hundreds of video recordings of readings and interviews with several of the most notable, prize-winning authors in the field, including Félix Morisseau-Leroy, George Lamming, Antonio Benítez-Rojo, Maryse Condé, Earl Lovelace, Angie Cruz, Edward Baugh, Kamau Brathwaite, J. Michael Dash, Erna Brodber, and Edwidge Danticat.
Click here to visit the CWSI Video Collection
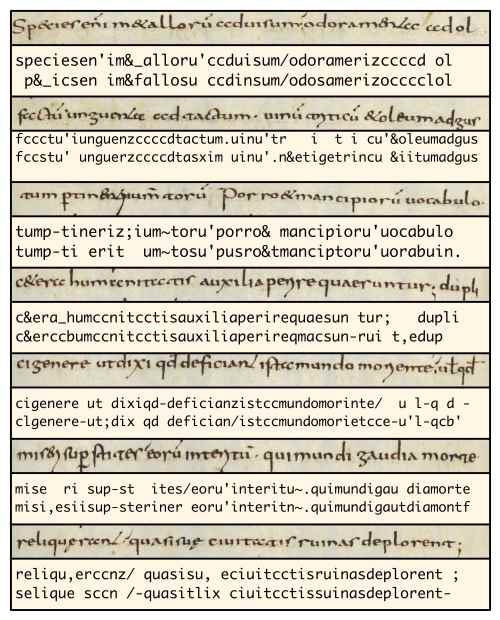
Back to the Future: Studying Ancient Manuscripts through Modern Technology
Mitsunori Ogihara (Computer Science, UM), Dimitris Papamichail (Computer Science, College of New Jersey), Wilson Shearin (Classics, UM) and Gavriil Tsechpenakis (Computer Science, IUPUI).
While the ancient Mediterranean world stands chronologically removed from the world of modern technology, it nevertheless presents problems for which the best solutions lie precisely in that technology. A case in point: a team of scholars based at UM has been developing software tools to aid in the study of ancient manuscripts, the most important sources of information about the ancient world. All of the great authors from Mediterranean antiquity such as Homer, Plato, Sophocles, Vergil, Cicero, and Horace survive by virtue of handwritten copies that were made, often with great care, but also with many arcane abbreviations and without modern punctuation. The UM team has developed a software tool to "read" manuscripts written in a specific, difficult hand known as Carolingian minuscule. This tool, which operates through optical character recognition, transcribes the manuscripts into a modern typeface more readily accessible to both scholars and laymen.
Case Summary
Researchers across the sciences at UM use visualizations to clarify and communicate their data. Here we have examples from artificial intelligence research, drug development and weather modeling.
Researchers across the sciences at UM use visualizations to clarify and communicate their data. Here we have examples from artificial intelligence research, drug development and weather modeling.

Rational Polypharmacology
Hassan Al-Ali
Postdoctoral Associate at Miller School of Medicine, University of Miami
A single small-molecule kinase inhibitor is portrayed here binding to two different kinases in distinct parts of a neuron. The combined inhibition results in a synergistic effect on axon growth promotion. Inhibiting multiple targets enhances the drug’s therapeutic efficacy and safety in treating spinal cord injury. This visualization was created for the Miami Project to Cure Paralysis.
Click here for more information.
PhilPapers - Public
"PhilPapers is a comprehensive directory of online academic philosophy." - from PhilPapers.org
"PhilPapers is a comprehensive directory of online academic philosophy." - from PhilPapers.org
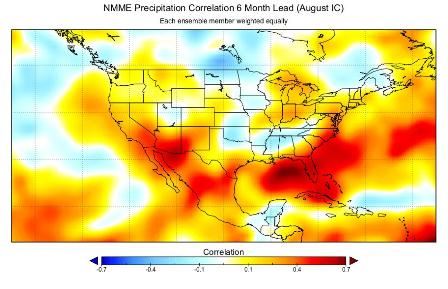
Modeling of Ocean Eddies
Benjamin Kirtman
Research faculty member at Rosenstiel School of Marine and Atmospheric Sciences, University of Miami
This simulation demonstrates the course of a virtual month in which a loop current forms, travels into the Gulf of Mexico, and dissipates. The figures show the evolution of surface current speeds from a global climate model simulation. This is the first time that ocean eddies from the loop current have been resolved in a global climate model. Warm colors correspond to strong currents and cold colors represent weak currents.
Click here for more information.

Ubbo Visser, Professor in the Department of Computer Science, University of Miami
Justin Stoecker, Master’s candidate in the Department of Computer Science,
University of Miami
Virtual soccer players compete in a simulated game of soccer in this visualization created with the program RoboViz, developed in the Department of Computer Science. Yellow dots show where each independent player thinks the ball may be. Blue dots leading to pink circles show their plans to head toward it or to block another player’s approach. The desired kicking path of the blue player with control of the ball is highlighted in gold.
Click here for more information.
Case Summary
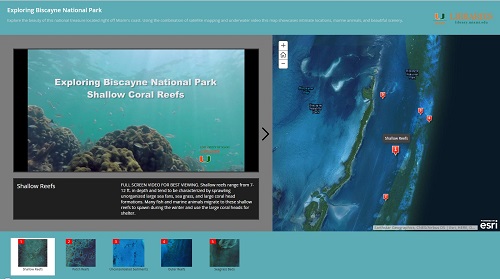
This exhibit is intended to be an educational showcase for the different types of mapping options available for the Biscayne National Park and its benthic habitats.
This exhibit is intended to be an educational showcase for the different types of mapping options available for the Biscayne National Park and its benthic habitats.
Through this exhibit you can learn to use widely available satellite imagery to interpret the bethic features of this area such and seagrass beds, patch reefs, shallow reefs, unconsolidated sediments, and outer reefs. Also available is GIS and coral bleaching information of these habitats through out Biscayne National Park with real life examples.
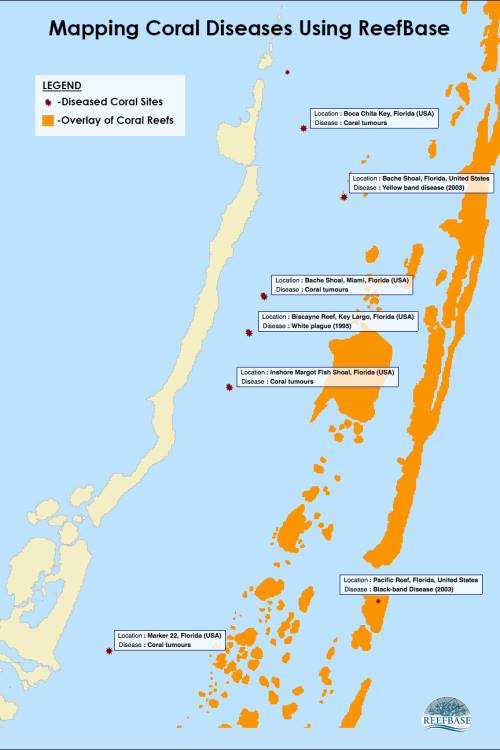
Reef Base
http://reefgis.reefbase.org
The website containing this map reflects the work of many different researchers and reports as well as catalogs and reflects the geographic locations of coral diseases occurring through out the world. This particular map shows data available in the Florida Keys Reef Tract, Specifically the section that resides in Biscayne National Park. Each red place mark is indicative of a specific type of coral disease that was found in that area. In addition to the information shown, access is available to the full reports on the locations shown at the website listed above.
Corals are susceptible to many different diseases due to stressors in their environment. The National Oceanic and Atmospheric Administration published the following information about coral diseases:
Black-band disease is characterized by a blackish concentric or crescent-shaped band, one to thirty millimeters wide and up to two millimeters long, that “consumes” live coral tissue as it passes over the colony surface, leaving behind bare skeleton. The disease is caused primarily by a cyanobacterium in combination with sulfide-oxidizing bacteria and sulfur-reducing bacteria.
White pox affects elkhorn coral in the Florida Keys and possibly throughout the Caribbean. First found in 1996, the disease is characterized by white circular lesions on the surface of infected colonies. The rate of tissue damage appears to be rapid, allowing for algal colonization within days. The cause of white pox remains a mystery, but a possible bacterial pathogen has been identified (Porter, 2002).
When corals are inordinately stressed, they often expel their zooxanthellae, or the concentration of photosynthetic pigments declines. This response is known as bleaching (Glynn, 1996). During a bleaching event, a coral’s coloration disappears or becomes pale, and the white of the coral skeleton shows through the translucent coral tissue. Localized bleaching has been attributed to exposure to high light levels, increased ultraviolet radiation, temperature or salinity extremes, high turbidity and sedimentation resulting in reduced light levels, and other abiotic factors (Glynn, 1996).
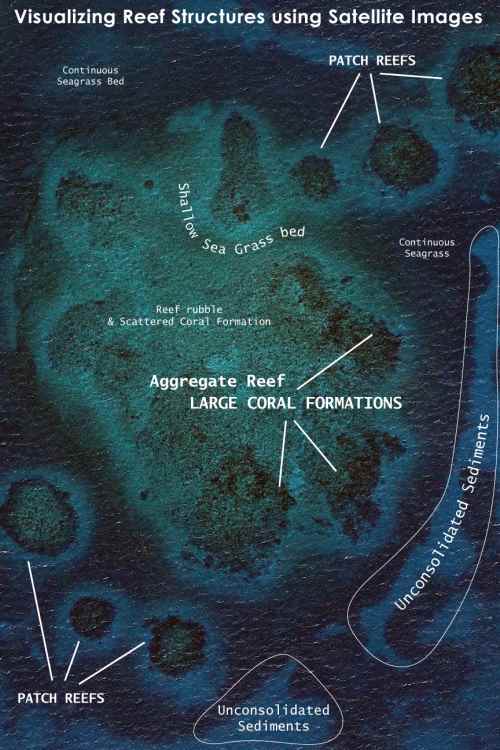
This is a close up 10-meter resolution satellite photograph of a large aggregate reef formation in Biscayne National Park. The purpose of this image is to distinguish between the different types of habitat located in a 1000-square-foot area.
Google Earth
Satellite images are fast becoming the “Go-To” tool for modern GPS and environment assessment surveys. There is a variety of visible spectrum imagery available from different of satellites including iKonos, Ortho-Imagery as well as Digital Globe imagery provided by Google Earth. These easily accessible tools are revolutionizing our ability to make observations about our global environment.
The Florida Keys and Elliot Key form a barrier island chain that is comprised mostly of oolitic limestone. Portions of this limestone break the surface at various locations and provide homes and habitat for many fish, invertebrates, small crabs, and lobster. The inner reef in this location is small and patchy and comprised mostly of boulder star coral heads and gorgonians. Due to storms and sedimentation the majority of corals in this reef are unable to photosynthesize. Additional stress from warm water buildup causes bleaching and coral death in this habitat as well.
Florida Keys National Marine Sanctuary Zone Review – Coral Reef Ecosystem Restoration
ArcGIS (data provider: mr_pole)
ArcGIS is a tool offered by the UM Libraries that allows you to access different data sets that users have posted or create a map to display your own data. This map is an excellent outline of the different types of benthic habitats and their locations within Biscayne National Park. Using maps like this one to cross reference with a visible imagery map, a user could learn about different habitats and ecosystems and how they interact with each other on a regional scale.
Outer Reefs and Drop Off
Outer reefs in Biscayne National Park range from three to twenty-five meters in depth and are characterized by spur and groove coral formation and a large drop off on one side of them. The outer reefs in BNP used to be covered with large amount of Elkhorn Coral (Acropora palmate), but due to overexposure to warm water, sun light, ultraviolet radiation, and agricultural runoff the presence of this type of coral is now extremely rare on the outer reefs. The drop-off is the drop from the outer reef coral ridges to continental shelf. This area contains deeper reefs to the depth of about fifty meters.
Sea Grass Beds
There are three types of sea grasses growing in Biscayne National Park. Most of the large sea grass beds in the park are mainly comprised of Turtle Grass.
Turtle grass (Thalassiatestudinum) has wide leaf blades and a deep root structure, and forms most of the large, lush seagrass meadows found in the park. Sea turtles and some fish like parrotfish feed on turtle grass.
Manatee grass (Syringodiumfiliforme) is recognized easily because of its cylindrical leaves. Like its name suggests, manatees feed on this type of seagrass.
Shoal grass (Halodulewrightii) is an early colonizer of disturbed areas and usually grows in very shallow water. The leaves are generally smaller than the other two species.
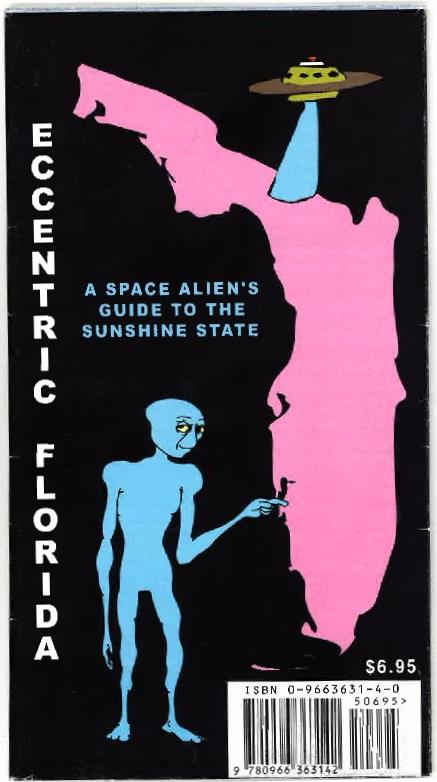
Eccentric Florida: A Space Alien’s Guide to the Sunshine State
Eccentric California Press
Monterey, CA : Eccentric California, c2004
It’s obvious to anyone who’s ever lived in or visited the Sunshine State that Florida is a unique place with a rich, varied culture, a wealth of history – and a lot of quirks. There isn’t anywhere else in the country that’s quite like Florida, and this road map will take you on a tour of all the fun, quirky, and particularly unique aspects of our sunny peninsula.
From lost pirate treasure and roller-skating fairies, haunted warehouses, strange sea monsters and a famous mouse, Florida is full of special places unlike anywhere else!
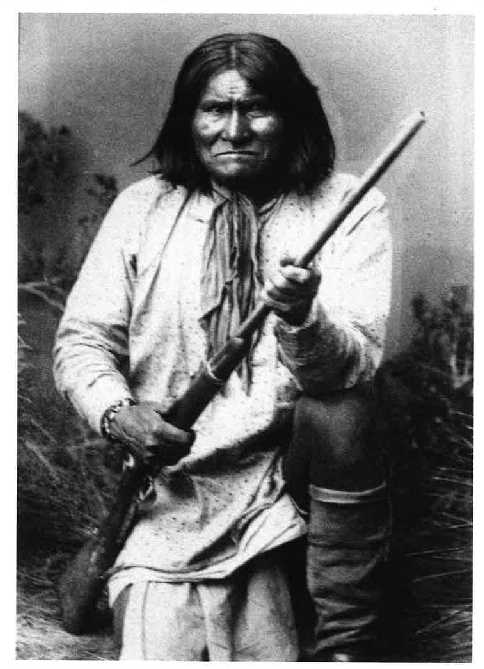
Geronimo
Police Station
Carrabelle claims to have the world’s smallest police station. On Highway 98, look for the official telephone booth with the police car next to it. Also look for the real police station a few blocks away.
Gatorade
The sports drink was developed in 1965 for the University of Florida Gators football team who suffered dehydration during practice in the Florida heat.
Hamburger Hall of Fame
The International Hamburger Hall of Fame is a collection of everything “hamburger” in the home of Harry Sperl in Daytona Beach.
State Road
The hard packed sand of Daytona Beach is a legal state highway. Races were held here until the Daytona International Speedway opened in 1959.
Disney’s Epcot Park
The “Mouse that ate Central Florida.” Orlando and the surrounding county was a forgotten backwater in 1964 when Disney began a secret project to buy up 30,000 acres, much of it swamp and jungle. With an area twice the size of Manhattan, he wanted to build a new resort that would fix many of the problems with the original Disney Land in Anaheim. The first was lack of room to expand and the second was the growth of tacky hotels, fast food restaurants and billboards just outside the parking lot. With only 7,000 acres developed to date, he got his first wish but the seediness followed close on his heels. Even worse, I-4 is a bumper to bumper nightmare on most days.
Walt’s primary vision, which he didn’t live to see, was Epcot, which was to be “the home of tomorrow” with actual residents. The vision morphed in design as the quirks, needs, and idiosyncrasies of real people got in the way. The community aspect was finally dropped only to rise again as the nearby town of Celebration.
Bermuda Triangle
The Bermuda Triangle is an area from Bermuda to Miami to Puerto Rico (some include Key West and the Azores) known for mysterious cases of lost ships and aircraft. The story originated in an article in the pulp magazine, Argosy, in 1969, about Flight 19, a patrol of Navy Avenger torpedo bombers that disappeared on December 5th, 1945. Now considered to be an area of strange natural and supernatural phenomena that can swallow ships, planes and crews.
The Bermuda Triangle is an area from Bermuda to Miami to Puerto Rico (some include Key West and the Azores) known for mysterious cases of lost ships and aircraft. The story originated in an article in the pulp magazine, Argosy, in 1969, about Flight 19, a patrol of Navy Avenger torpedo bombers that disappeared on December 5th, 1945. Now considered to be an area of strange natural and supernatural phenomena that can swallow ships, planes and crews.
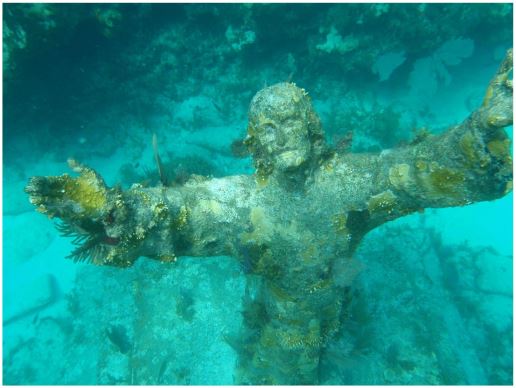
Christ of the Deep
The famous Italian sculpture is the most popular dive spot in America. It was placed in 25 feet of water about 8 miles east of Key Largo in 1965. For non-divers, a replica stands outside the Catholic Church at mile marker 105.5. ​
Giant Lobster
This famous roadside attraction is on the ocean side of Highway 1, mile marker 87. Florida lobsters have no claws.
Giant Lobster
This famous roadside attraction is on the ocean side of Highway 1, mile marker 87. Florida lobsters have no claws.
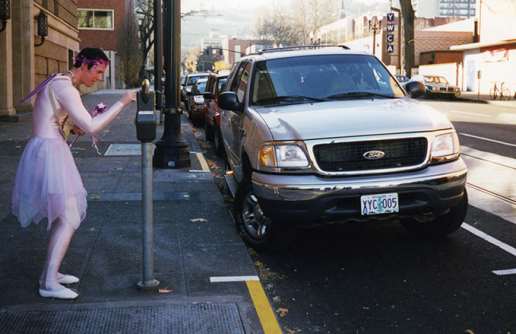
Tinker Bell
When new parking meters began hurting business in Coconut Grove, local merchants hired Xavier Cortes, who rollerblades around town with a wand, fairy wings and a pink tutu feeding expired meters.
Hauntings
There are dozens of reported hauntings across the state of Florida. A poltergeist is said to exist at Haslam’s Bookstore in St. Petersburg, with recordings of books and other objects flying off shelves and sharp temperature changes.
The Don Cesar Beach Spa at St. Pete’s Beach is believed to be haunted by the ghost of Thomas Rowe, who built the hotel in 1928. Apparitions are of an older man in a dark suit and panama hat.
One of the best documented cases of poltergeist activity was in 1966-1967 when parapsychologists from Duke University investigated the reports from the Miami warehouse of Tropication Arts, Inc. that stock flew off shelves and floated around. An emotionally disturbed 19 year old Cuban shipping clerk, Julio Vasquez, was associated with the activity which stopped when he was fired.
​
Shark Tooth
Venice Beach is one of the most productive fossil shark tooth collecting beaches in the world. Look for the darker colored sands. For the diver, the source is the reef one-quarter mile offshore in 30 ft. Year after year, many jewelry grade 3” teeth are found along with the occasional 8” megalodon tooth.
King of the Pirates
The king of the pirates was Jose Gasparilla, the swashbuckling Spaniard and the “last of the buccaneers.” He sailed out of Charlotte Harbor and Gasparilla Island from 1782 until he was tricked into attacking a US frigate in 1821. In his last act of defiance he wrapped himself in anchor chain and jumped overboard. Searches for his lost pirate treasure continue. There is an annual Gasparilla pirate festival in Tampa in February.
Tupperware
In 1949, Earl Tupper patented his famous burping seal, launching a revolution in the food container industry. At the height of his success in 1958, he sold the company, bought an island off Costa Rica and moved there for isolation and security.
Strawberry
The town of Plant City is the Winter Strawberry Capital of the World, supplying more than three quarters of the strawberries consumed in the US. Plant City also holds the Guinness book record for the largest strawberry shortcake at 827 square feet, 6,000 pounds, in 1999.
Pink Elephant
A pink elephant stands outside of Shelton’s Nursery in Brandon. The story behind it has been lost, but the city council considers it a historic landmark.
Sea Monster
A newspaper report from 1891 claims that a sea monster chased bathers from the Jacksonville beach. It was described as having a dog-like head and a long neck. There were also numerous reports between 1955 and 1961 of a brontosaurus-like monster in the St. Johns River near Blue Springs.
Penguin
In 1948, a Clearwater newspaper reported numerous sightings of a giant penguin-looking bird on the beaches of the area and the Suwanee River. Large footprints were noted as well as one report by boaters of a large bird swimming offshore.
Case Contents
Hartvigsen, Gregg. A Primer in Biological Data Analysis and Visualization Using R. New York: Columbia University Press, 2014. E-book.
Krešić, Neven. Hydrogeological Conceptual Site Models: Data Analysis and Visualization. Boca Raton, FL: CRC Press, 2013. E-book.
Krum, Randy. Cool Infographics: Effective Communication with Data Visualization and Design. Indianapolis, IN: Wiley, 2014. E-book.
Murray, Dan. Tableau Your Data! Fast and Easy Visual Analysis with Tableau Software. Hoboken: Wiley, 2013. E-book.
Murray, Scott. Interactive Data Visualization for the Web. Sebastopol, CA: O'Reilly Media, 2013. E-book.
Ruthkoski, Traci L. Google Visualization API Essentials: Make Sense of Your Data, Make It Visual with the Google Visualization API. Birmingham, UK: Packt Pub, 2013. E-book.
Simon, Phil. The Visual Organization: Data Visualization, Big Data, and the Quest for Better Decisions. Hoboken, New Jersey: Wiley, 2014. E-book.
Stacey, Mark. Visual Intelligence: Microsoft Tools and Techniques for Visualizing Data. Indianapolis, IN: Wiley, 2013. E-book.
​
Wainer, Howard. Medical Illuminations: Using Evidence, Visualization and Statistical Thinking to Improve Healthcare. Oxford; New York: Oxford University Press, 2014. Print.
Case Summary
GIS is a computer system that allows you to query, analyze, map, and model large quantities of data according to their location. GIS can display many “layers” of information on one map, enabling viewers to see and understand complex relationships and patterns that would not be evident from scanning numbers on a spreadsheet. The sorts of information that can be mapped include disease outbreaks, housing patterns, weather phenomena, voting results and much more. It can be a valuable tool for businesspeople, policymakers and planners for both gathering and conveying information.
GIS is a computer system that allows you to query, analyze, map, and model large quantities of data according to their location. GIS can display many “layers” of information on one map, enabling viewers to see and understand complex relationships and patterns that would not be evident from scanning numbers on a spreadsheet. The sorts of information that can be mapped include disease outbreaks, housing patterns, weather phenomena, voting results and much more. It can be a valuable tool for businesspeople, policymakers and planners for both gathering and conveying information.
Case Contents
 ​​
​​
Arlinghaus, Sandra L. Spatial Mathematics: Theory and Practice through Mapping. Boca Raton: CRC Press, 2013. Print.
Bray, Hiawatha. You Are Here: From the Compass to GPS, the History and Future of How We Find Ourselves. New York: Basic Books, 2014. Print.
Dessers, Ezra. Spatial Data Infrastructures at Work: Analysing the Spatial Enablement of Public Sector Processes. Belgium: Leuven University Press, 2013. Print.
Gregory, Ian N., ed. Toward Spatial Humanities: Historical GIS and Spatial History. Bloomington: Indiana University Press, 2014. Print.
Hart, Glen. Linked Data: A Geographic Perspective. Boca Raton: CRC Press, 2013. E-book.
Karim, Hassan A., ed. Big Data: Techniques and Technologies in Geoinformatics. Boca Raton: CRC Press/Taylor & Francis Group, 2014. E-book.
Meehan, Bill. GIS for Enhanced Electric Utility Performance. Boston: Artech House, 2013. Print.
Muehlenhaus, Ian. Web Cartography: Map Design for Interactive and Mobile Devices. Boca Raton: CRC Press, 2014. Print.
Pistocchi, Alberto. GIS Based Chemical Fate Modeling: Principles and Applications. Hoboken, New Jersey: John Wiley & Sons, Inc., 2013. E-book.
Price, Maribeth Hughett. Mastering ArcGIS. New York: McGraw-Hill, 2014. Print.
​​Arlinghaus, Sandra L. Spatial Mathematics: Theory and Practice through Mapping. Boca Raton: CRC Press, 2013. Print.
Bray, Hiawatha. You Are Here: From the Compass to GPS, the History and Future of How We Find Ourselves. New York: Basic Books, 2014. Print.
Dessers, Ezra. Spatial Data Infrastructures at Work: Analysing the Spatial Enablement of Public Sector Processes. Belgium: Leuven University Press, 2013. Print.
Gregory, Ian N., ed. Toward Spatial Humanities: Historical GIS and Spatial History. Bloomington: Indiana University Press, 2014. Print.
Hart, Glen. Linked Data: A Geographic Perspective. Boca Raton: CRC Press, 2013. E-book.
Karim, Hassan A., ed. Big Data: Techniques and Technologies in Geoinformatics. Boca Raton: CRC Press/Taylor & Francis Group, 2014. E-book.
Meehan, Bill. GIS for Enhanced Electric Utility Performance. Boston: Artech House, 2013. Print.
Muehlenhaus, Ian. Web Cartography: Map Design for Interactive and Mobile Devices. Boca Raton: CRC Press, 2014. Print.
Pistocchi, Alberto. GIS Based Chemical Fate Modeling: Principles and Applications. Hoboken, New Jersey: John Wiley & Sons, Inc., 2013. E-book.
Price, Maribeth Hughett. Mastering ArcGIS. New York: McGraw-Hill, 2014. Print.
Case Summary
Data visualization is the presentation of data in pictorial or graphical format. Its form is shaped by a desire to effectively convey data to viewers. Visualization of data can be achieved through charts and maps; however, scholars and researchers have moved far beyond these traditional methods to techniques that expose otherwise hidden relationships. The resulting “visualizations” convey data in new and unexpected ways that can result in impressive scholarship and stunning works of art.
Data visualization is the presentation of data in pictorial or graphical format. Its form is shaped by a desire to effectively convey data to viewers. Visualization of data can be achieved through charts and maps; however, scholars and researchers have moved far beyond these traditional methods to techniques that expose otherwise hidden relationships. The resulting “visualizations” convey data in new and unexpected ways that can result in impressive scholarship and stunning works of art.
Case Summary
The following is the visualization of the preliminary results of the stable isotopic data, recorded from the sediments collected at Hamelin Pool in March 2013. Researchers at RSMAS have an ongoing research project to better understand the physical, biological, and chemical nature of Hamelin Pool, which had been deemed a World Heritage Site based on its important ecosystems. These results will be combined with other data in order to better understand this special and delicate environment.
A Geochemical Analysis of Shark Bay’s Hamelin Pool, Western Australia
Sean P. Ahearn
Graduate Student at the Rosenstiel School of Marine and Atmospheric Science (RSMAS)
Advisor: Dr. Peter K. Swart, Professor, RSMAS
Principal Investigators: Pam Reid and Gergor Eberli, Professors, RSMAS
Erica Parke and Paige Giusfredi, Graduate students, RSMAS
Phil Playford, Geological Survey of Western Australia
On the westernmost point of Australia, this “W” shaped, 2.2 million-hectare oceanic wilderness harbors ancient, globally endangered species. Complex interactions between the bay’s sea grass meadows, climate conditions, and Asia-Pacific marine environment have allowed unusual “living fossils,” stromatolites, to thrive, much as they did at the dawn of time in the Hamelin Pool area. Shark Bay’s extraordinary natural riches led to its recognition as a World Heritage Site in 1991.
Hamelin Pool is home to the most diverse and abundant examples of living stromatolites in the world. These creatures are monuments to life on Earth over 3.5 billion years ago; a time when no other complex creatures were present on the planet. Modern day stromatolites are mostly found in hypersaline lakes and lagoons where predation is minimal.
At the Rosenstiel School of Marine and Atmospheric Sciences (RSMAS) a team of researchers has been working to better understand the microbiology, environmental conditions, petrography, and geochemical composition of Hamelin Pool. Understanding these conditions can give scientist massive insights into Earth’s early environmental conditions.
The following data presented is a portion of geochemical data; the stable isotopic results for the surface sediments collected in March 2013.
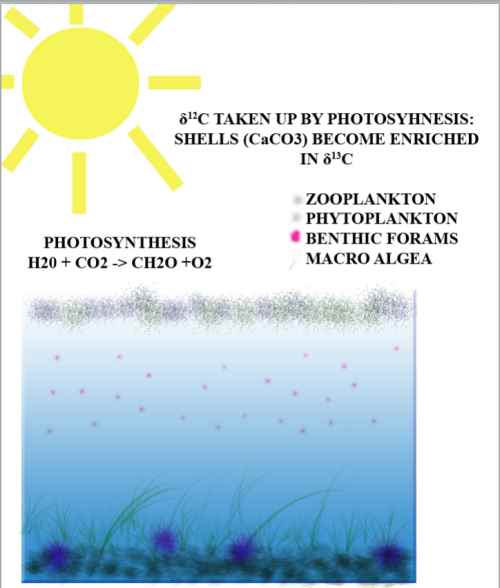
Atoms of the same element can have different numbers of neutrons; the different possible versions of each element are called isotopes. Scientist use stable isotopes to track environmental changes as stable isotopes are affected by environmental factors.
In the above image we can see factors associated with carbon isotopes in the ocean. Carbon as a part of Carbon Dioxide (CO2) exists primarily as 12C there is also the radioactive 14C and the stable 13C.The difference in the amount of 12C to 13C is recorded as δ13C. As life in water persists organisms like zooplankton, phytoplankton, and microalgae are photosynthesizing. As this reaction takes place the CO2 species with 12C are preferentially removed leaving behind water enriched in 13C.
This enriched water is then a source for calcifying organisms such as algae, forams, gastropods, ect. to make their shells by way of Calcium Carbonate (CaCO3) and inadvertently records the δ13C signature.
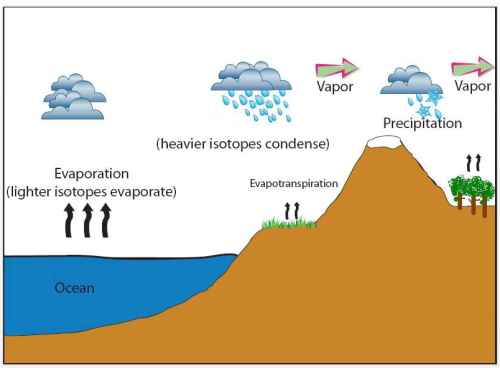
Atoms of the same element can have different numbers of neutrons; the different possible versions of each element are called isotopes. Scientist use stable isotopes to track environmental changes as stable isotopes are affected by environmental factors.
In the above image we can see factors associated with oxygen isotopes in the ocean. Oxygen as a part of Water (H2O) exists primarily as 16O there is also 17O and 18O.The difference in the amount of 16O to 18O is recorded as δ18O. As radiation from the sun evaporates water at the surface the H2O species with 16O are preferentially removed leaving behind water enriched in 18O.
This enriched water is then a source for calcifying organisms such as algae, forams, gastropods, ect. to make their shells by way of Calcium Carbonate (CaCO3) and inadvertently records the δ18O signature.
The image above shows the range of δ18O values which was found when the surface sediments were analyzed. The range of the values proves to be high and shows that the water which enters Hamelin Pool stays or resides there for a long period of time and is therefore subject to longer periods of evaporation. One may notice an increase in the values from North to South this implies a shorter time in the North and longer time in the South. These results agree with the main sources of water in to the pool as being from the Indian Ocean to the North.
With this data we can not only confirm water movement with naturally occurring stable isotopes but we are able to confirm that the surface sediments are in fact reflecting water chemistry on a resolution of decameters and decades. This information can help paleoclimatologist rebuild Earth’s early past with this unique modern analog.
The University of Miami Libraries’ General Map Collection
The map collection housed in this hallway is the largest collection in South Florida. It contains over 60,000 sheets with coverage of every part of the world and even other planets. In addition to the usual topographic and road maps, there are many special types such as geologic, historical, and thematic. A selection of these maps are on display.
The map collection housed in this hallway is the largest collection in South Florida. It contains over 60,000 sheets with coverage of every part of the world and even other planets. In addition to the usual topographic and road maps, there are many special types such as geologic, historical, and thematic. A selection of these maps are on display.
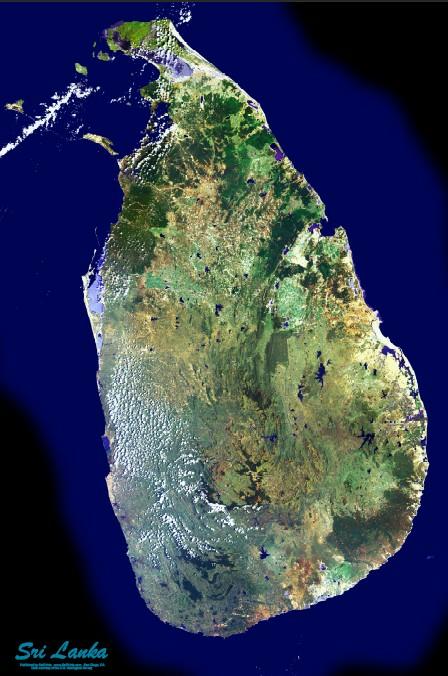
Sri Lanka
San Diego, CA: SatPrints, 2008
Images taken by satellites are not only beautiful but can also be useful in scientific studies. This image shows the natural coloration of the landscape. Other may use specific frequencies, such as infrared, in order to highlight certain types of features.
International Travel Map of Bali, Indonesia
Multi Mapping, Ltd.
Vancouver, B.C.: International Travel Maps, 2001
Multi Mapping, Ltd.
Vancouver, B.C.: International Travel Maps, 2001
Geological Map of the Santorini Islands
T.H. Druitt
London: Geological Society, 1999
Geologic maps always include a detailed index to the colors and coding used, as seen along the left edge. The Santorini Islands are well known as one possible site of the legendary land of Atlantis.
T.H. Druitt
London: Geological Society, 1999
Geologic maps always include a detailed index to the colors and coding used, as seen along the left edge. The Santorini Islands are well known as one possible site of the legendary land of Atlantis.
Peninsula Valdes Ecomapa, Argentina
Dario Urruty
Buenos Aires: Zagier & Urruty Publicaciones, 1998
As ecotourism has risen in popularity, so has the production of maps that focus on the ecology of a particular region. These kinds of maps often include drawings or photographs to help tourists identify various species.
Dario Urruty
Buenos Aires: Zagier & Urruty Publicaciones, 1998
As ecotourism has risen in popularity, so has the production of maps that focus on the ecology of a particular region. These kinds of maps often include drawings or photographs to help tourists identify various species.
Ancient Egypt
Allen Carroll
Washington, D.C.: National Geographic Society, 2001
This map manages to incorporate both modern and historical information. The insets along the left highlight crucial periods in the history of the Egyptian Empire while the timeline along the right helps to put these periods into perspective. The central map highlights the locations of ancient remnants in modern Egypt.
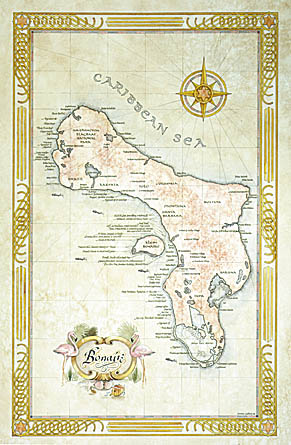
Bonaire
Austin, TX: One Treasure Ltd., 1996
This is an example of a tourist souvenir map. It is a modern map but has been given an antique, decorative design in order to provide tourists with a memory worth framing.
Afghanistan Country Profile
Washington, D.C.: Central Intelligence Agency, 2012
The CIA is well known for their maps of foreign countries. They usually include a basic map as well as standard thematic maps like population density. Sometimes, they also include specialty maps that are unique to that area such as, in this case, poppy cultivation.
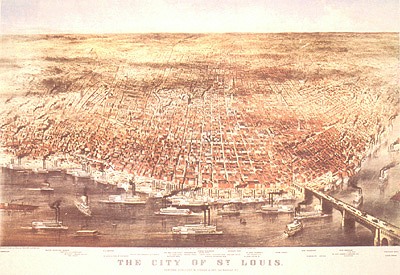
The City of St. Louis
Parsons & Atwater
Ithaca, NY: Historic Urban Plans, 1976
Facsimile of a map originally published in 1874 by Currier & Ives
This is an example of a birds-eye view of a major city, a common technique used in the U.S. during the nineteenth century. The index of key buildings below the map refers to buildings located directly above their name and drawn slightly larger than the surrounding structures.
Birds Eye View of Florida and Part of Georgia and Alabama
John Bachmann
St. Augustine, Fla.: Historic Print and Map Co., 2006
Facsimile of a map originally published in 1861.
The birds-eye view was often employed by cartographers during the early exploration of a region. The decorative elements helped to distract users from the inaccuracies and inadequacies of the map itself.
Florida
Don Mills, Ontario: Unique Media, 2001
In this modern birds-eye view, although the content has improved over the historical map above, it is clear that the decorative elements are still the main focus.
Don Mills, Ontario: Unique Media, 2001
In this modern birds-eye view, although the content has improved over the historical map above, it is clear that the decorative elements are still the main focus.
Hurricane Andrew, August 24, 1992
U.S. Geological Survey, National Mapping Division, Earth Resources Observation and Science (EROS) Center
This satellite image captured the fury of Hurricane Andrew just after it had ripped through Miami-Dade County. At the time, it was called the greatest natural disaster in the history of the United States. The final analysis listed Andrew as a Category 5 storm.
Treasures of the World, Lost and Found
Allen Carroll
Washington, D.C.: National Geographic Society, 2001
This map uses a combination of cartography and images to display the data. By using only short bursts of text, the creators can convey a lot of information without losing the interest of the reader.
Allen Carroll
Washington, D.C.: National Geographic Society, 2001
This map uses a combination of cartography and images to display the data. By using only short bursts of text, the creators can convey a lot of information without losing the interest of the reader.
The Book of the World
New York: Macmillan, 1996
Unlike standard atlases of the past, this book includes many satellite images of our planet. They are used to showcase unusual surface features and various environments around the world.
New York: Macmillan, 1996
Unlike standard atlases of the past, this book includes many satellite images of our planet. They are used to showcase unusual surface features and various environments around the world.
The American Atlas, 1776
Thomas Jefferys
London: Times Newspapers Ltd., 1976
Facsimile of the atlas first published in 1776.
Thomas Jefferys
London: Times Newspapers Ltd., 1976
Facsimile of the atlas first published in 1776.
This commemorative edition of the first atlas published in the newly established United States was produced in honor of this country’s bicentennial. It provides a fascinating insight into how the colonials viewed their world.
Barrington Atlas of the Greek and Roman World
Richard J.A. Talbert, editor
Princeton, N.J.: Princeton University Press, 2000
Unlike most historical maps, the people who created this atlas did not print the historical information on top of a modern map. These maps show only the cities, roads, and other features that existed at the time of the Greek and Roman Empires and only covers those parts of the world of which those people would have had direct knowledge.
Student Gallery
Geographic Information Systems (GIS) are now widely used as a means of visualizing data and are often included as part of a student’s training in many different fields. These posters are examples of work done by current University of Miami students.
Geographic Information Systems (GIS) are now widely used as a means of visualizing data and are often included as part of a student’s training in many different fields. These posters are examples of work done by current University of Miami students.
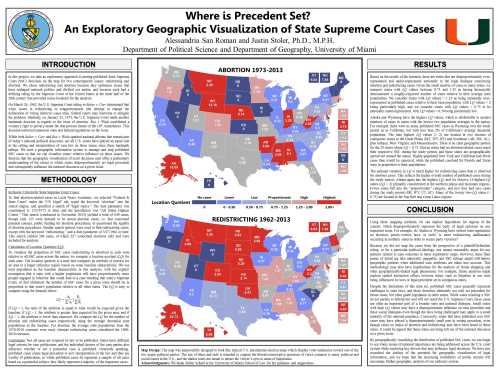
Where is Precedent Set? An Exploratory Geographic Visualization of State Supreme Court Cases
Alessandria San Roman
Master’s candidate in the Department of Political Science, University of Miami
Master’s candidate in the Department of Political Science, University of Miami
Vast data warehouses of legal documents and court decisions present an opportunity for data visualization and analysis, yet court decisions have rarely been visualized geographically. These maps suggest that the geographic visualization of court decisions may aid the generation and testing of hypotheses about whether or not certain states disproportionately set legal precedent and subsequently influence the national discourse on a given issue. This type of visualization may also have implications for forum shopping and other geographically-explicit legal strategies.
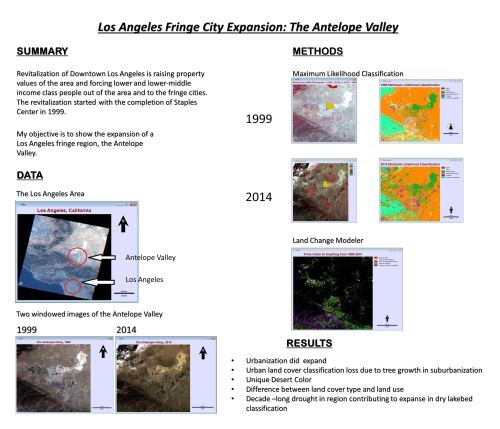
Los Angeles Fringe City Expansion: The Antelope Valley
M. Chance Scott
Master’s candidate in the Department of Geography & Regional Studies, University of Miami
The revitalization of downtown Los Angeles is raising property values in the area and forcing low and lower-middle income class people out of the area and into the fringe cities. The revitalization started with the completion of Staples Center in 1999. The objective of this study is to show the expansion of a Los Angeles fringe region, the Antelope Valley.
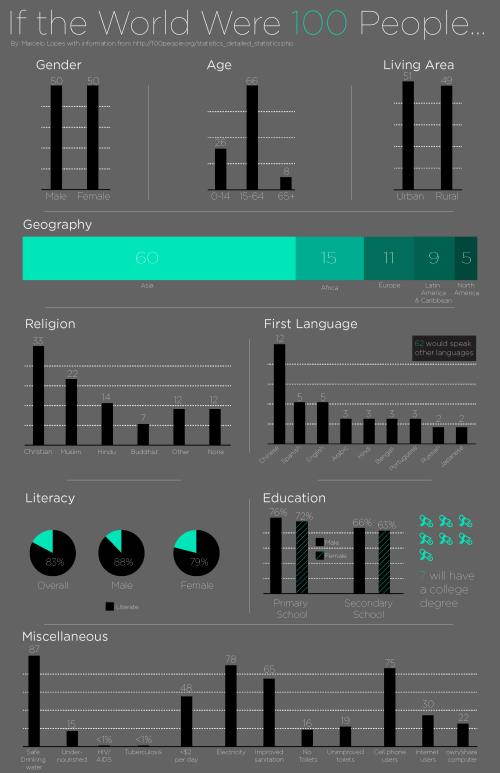
If the World Were 100 People…
Marcelo Lopes
Undergraduate student. School of Communication.
This is a visualization of the data from 100people.org, a foundation that frames the global population as 100 people for better understanding of issues facing our planet. I was inspired to create this infographic after seeing another attempt at visualizing this interesting data in a confusing format which did it no justice. Adobe Illustrator was used to create this infographic.
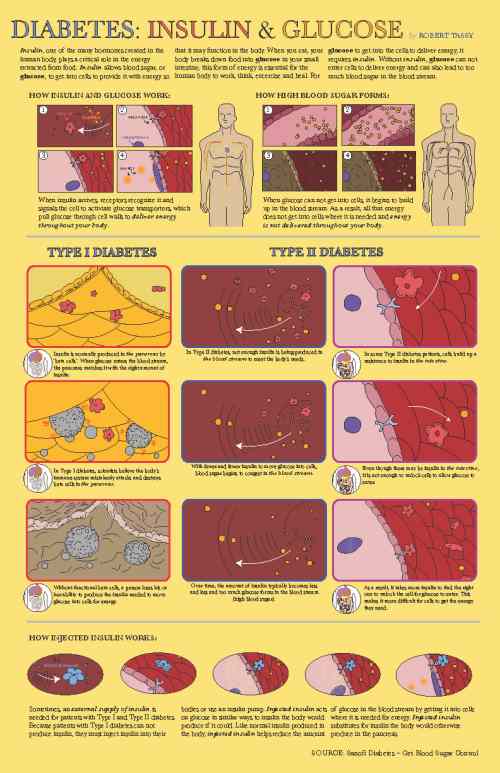
Diabetes: Insulin & Glucose
Robert Tassy
Graduate student. School of Communication
This infographic poster describes how insulin and blood sugar interact, and what mechanisms can lead to Type I and Type II diabetes. It was part of the coursework of the graduate-level visualization course at the School of Communication. The intended audience was patients that need a good understanding of their condition.
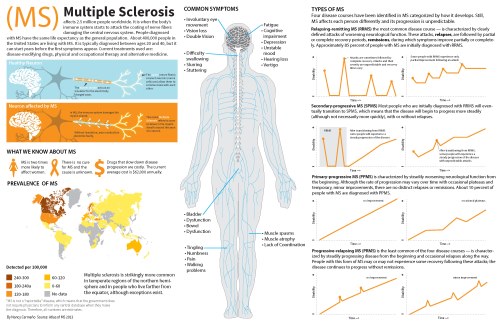
Multiple Sclerosis
Nancy Cermeño
Undergraduate student. School of Communication.
This infographic explains how multiple sclerosis affects the human nerve system. It was designed as part of the Introduction to Infographics and Visualization course in the School of Communication.
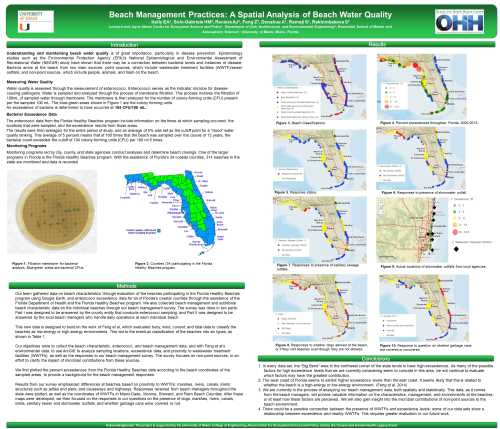
Beach Management Practices: A Spatial Analysis of Beach Water Quality
Elizabeth Kelly
Elizabeth Kelly
Doctoral candidate at the Leonard and Jayne Abess Center for Ecosystem Science and Policy, University of Miami
This work uses GIS to provide spatial characterization of beaches that are part of the Florida Healthy Beaches Program, which monitors water quality in all of the state’s 34 coastal counties. This program tracks fecal indicator bacteria (enterococci), which indicates the presence of pathogenic viruses and bacteria that can be in an environment when fecal material is present. These data are measured to determine whether a beach can remain open or if it should be closed.
The author is currently conducting a survey, with the assistance of the county beach managers and the individual beach managers, to characterize each beach in the program. She has begun to enter some of the data into GIS to visualize the answers received from the counties and to compare them to enterococci exceedences as reported from 2000-2013.
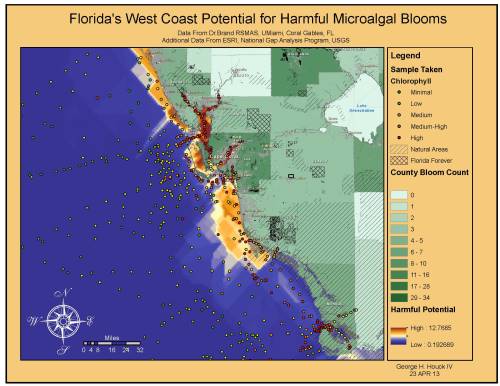
Florida’s West Coast Potential for Harmful Microalgal Blooms
George H. Houck IV
Undergraduate student in the Department of Geography & Regional Studies, University of Miami
The study was to determine if chlorophyll levels in areas without harmful algal blooms would be sufficient to predict which of those areas are susceptible to future harmful algal blooms. The study then used GIS technology to map out the areas. These areas were then monitored for an accrual even that year for comparison.